While browsing the web for any BI related topics I recently came across this blog post about SAP HANA and how it can be used to analyze Big Data. Its actually pretty cool, SAP together with Amazon Web Services (AWS) offer a free try out of their tools for 4 hours which you can use to rebuild a predefined demo. The demo itself is very well explained and document with videos and scripts and gives some good insights on how to deal with Big Data in SAP HANA. Basically it is divided into 3 steps:
1) Load Wikipedia data (Pagehits, etc.) from Hadoop/Hive (~2GB of flatfiles)
2) Create a data mart with SAP HANA
3) Analyze results with SAP Lumira
Having done a lot recently with Power BI and its tools I asked myself if this would also be possible with Power BI? So I first did the demo on SAP HANA and afterwards I was quite sure that I could do the same also with Power BI.
And this was the initiation of this blog post where we will do the same demo but instead of SAP HANA we will use only tools of the Power BI suite. Basically we only use 3 of our Power tools:
1) Power Query to load the data
2) Power Pivot to build the “data mart”
3) Power View to analyze the data
First of all we need to load the data. The demo uses data from Wikipedia where for each year, month, day and hour the number of pagehits and bytesdownloaded are monitored per page: http://dumps.wikimedia.org/other/pagecounts-raw/
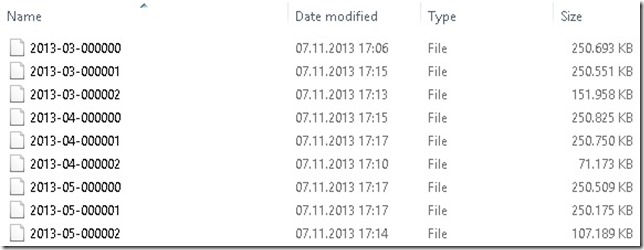
This data was then moved to a Hadoop/Hive cluster on AWS S3 store which was made public available. The transformed files can be downloaded here (~250MB per file):
http://wikipedia-pagecounts-hive-results.s3.amazonaws.com/year=2013/month=03/000000
http://wikipedia-pagecounts-hive-results.s3.amazonaws.com/year=2013/month=03/000001
http://wikipedia-pagecounts-hive-results.s3.amazonaws.com/year=2013/month=03/000002
http://wikipedia-pagecounts-hive-results.s3.amazonaws.com/year=2013/month=04/000000
http://wikipedia-pagecounts-hive-results.s3.amazonaws.com/year=2013/month=04/000001
http://wikipedia-pagecounts-hive-results.s3.amazonaws.com/year=2013/month=04/000002
http://wikipedia-pagecounts-hive-results.s3.amazonaws.com/year=2013/month=05/000000
http://wikipedia-pagecounts-hive-results.s3.amazonaws.com/year=2013/month=05/000001
http://wikipedia-pagecounts-hive-results.s3.amazonaws.com/year=2013/month=05/000002
Once we have downloaded the files we can start loading them using Power Query’s “Load from Folder” source. It is basically textdata which needs to be split into several columns first. The delimiter used is 0x0001 which in Power Query’s M-language needs to be resolved to “#(0001)”:
Splitter.SplitTextByDelimiter("#(0001)"),
{"Column1.1", "Column1.2", "Column1.3", "Column1.4",
"Column1.5", "Column1.6", "Column1.7", "Column1.8"})
The columns are defined as PROJECTCODE, PAGENAME, YEAR, MONTH, DAY, HOUR, PAGEHITCOUNTFORHOUR and BYTESDOWNLOADEDFORHOUR where PROJECTCODE can be further split into language code and the real project code. There is some more logic which I will not explain in detail like error handling, data conversions, etc., which are similar to what is done in the SAP HANA demo.
This is the final M-script I came up with:
Source = Folder.Files("E:\SAP\Big Data"),
FilteredRows = Table.SelectRows(Source, each ([Extension] = "")),
CombinedBinaries = Binary.Combine(FilteredRows[Content]),
ImportedText = Table.FromColumns({Lines.FromBinary(CombinedBinaries)}),
SplitColumnDelimiter = Table.SplitColumn(ImportedText ,"Column1",Splitter.SplitTextByDelimiter("#(0001)"),{"Column1.1", "Column1.2", "Column1.3", "Column1.4", "Column1.5", "Column1.6", "Column1.7", "Column1.8"}),
ChangedType = Table.TransformColumnTypes(SplitColumnDelimiter,{{"Column1.1", type text}, {"Column1.2", type text}, {"Column1.3", type number}, {"Column1.4", type number}, {"Column1.5", type number}, {"Column1.6", type number}, {"Column1.7", type number}, {"Column1.8", type number}}),
SplitColumnDelimiter1 = Table.SplitColumn(ChangedType,"Column1.1",Splitter.SplitTextByDelimiter("."),{"Column1.1.1", "Column1.1.2"}),
ChangedType1 = Table.TransformColumnTypes(SplitColumnDelimiter1,{{"Column1.1.1", type text}, {"Column1.1.2", type text}}),
ReplacedValue = Table.ReplaceValue(ChangedType1,null,"wp",Replacer.ReplaceValue,{"Column1.1.2"}),
InsertedCustom = Table.AddColumn(ReplacedValue, "PageHitsPerHour", each try Number.From([Column1.7]) otherwise 0),
InsertedCustom1 = Table.AddColumn(InsertedCustom, "BytesDownloadedPerHour", each try Number.From([Column1.8]) otherwise 0),
RemovedColumns = Table.RemoveColumns(InsertedCustom1,{"Column1.7", "Column1.8"}),
RenamedColumns = Table.RenameColumns(RemovedColumns,{{"Column1.3", "Year"}, {"Column1.4", "Month"}, {"Column1.5", "Day"}, {"Column1.6", "Hour"}, {"Column1.2", "PageName"}, {"Column1.1.1", "LanguageCode"}, {"Column1.1.2", "ProjectCode"}}),
InsertedCustom2 = Table.AddColumn(RenamedColumns, "Date", each #date([Year],[Month],[Day])),
ChangedType2 = Table.TransformColumnTypes(InsertedCustom2,{{"PageHitsPerHour", type number}, {"BytesDownloadedPerHour", type number}, {"Date", type date}}),
FilteredRows1 = Table.SelectRows(ChangedType2, each [PageHitsPerHour] < 53000000)
in
FilteredRows1
If you also did the demo on SAP HANA you found some quality issues in the data why you needed to remove rows with more than 53,000,000 PageHitsPerHour as this 5 rows mess up the whole analysis. The above M-script already handles this (last statement).
There are some more important things to mention here. First of all we are dealing with about 37M rows, so loading to datasheet will not work. Instead we need to load the data directly into Power Pivot. I had several memory issues when using 32bit Excel but after switching to a 64bit Excel everything went just fine. The import itself takes about 15 minutes which I think is OK for roughly 2GB of data and 37M rows.
Once the data is loaded into Power Pivot we need to load some additional data which are basically our lookup/dimension tables. They can also be imported from Wikipedia, in this case directly from the web:
http://wikipedia-proj-lang-codes.s3.amazonaws.com/UniqueProjectCodes.csv
http://wikipedia-proj-lang-codes.s3.amazonaws.com/UniqueLanguageCodes.csv
Both are very simple tables with only two columns. Again we can use Power Query to import them and add them to our Power Pivot data model.
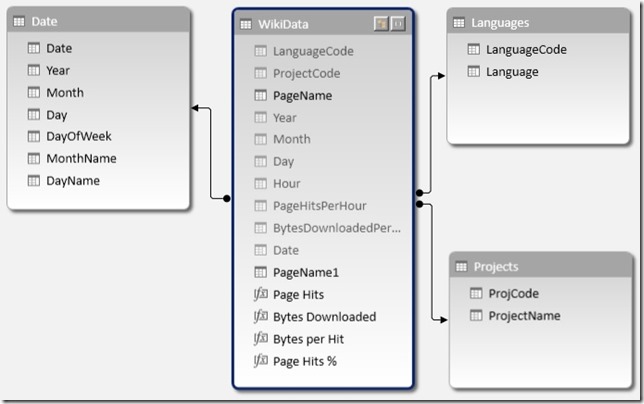
The last thing to add is a time-dimension.SAP HANA has its predefined time-dimension. In the case of Power BI I simply used a linked table in Excel that holds all necessary days or actually all days of 2013. Adding all those tables and linking them we end up with this pretty simple Power Pivot model:
This is very similar to what you create during the demo as an analytical view in SAP HANA so both approaches are very similar here.
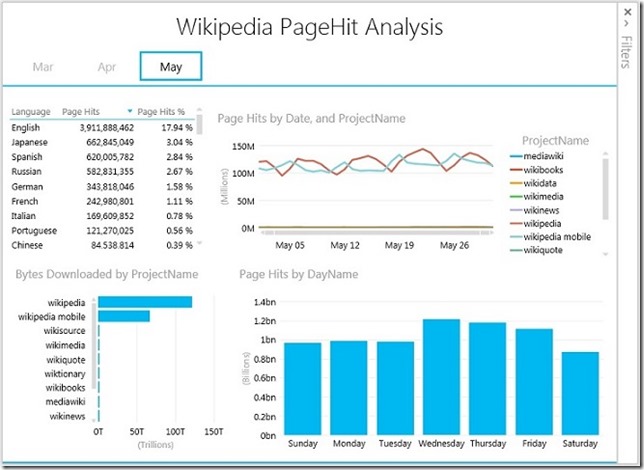
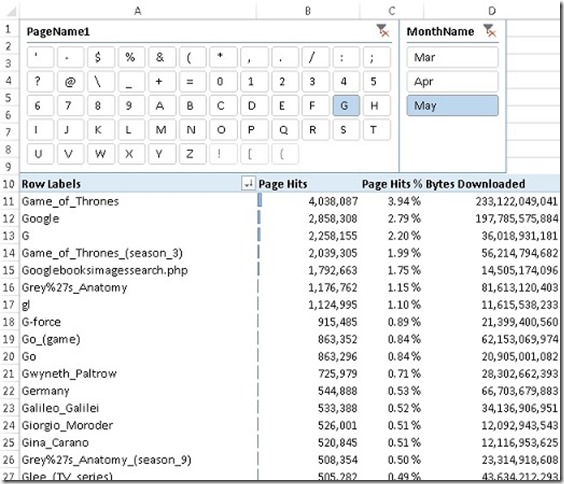
Now that the model is set up we can do our analysis using Power View and classic Excel Pivot Tables:
All together it took me about 2 hours to build the whole solution of which it took about 1h to download and process the data. The final workbook containing all the data has ~500MB which is mainly because of the PageName column which contains a high number of unique values which cannot be compressed very well. After removing the PageName column and some further tuning of the datamodel for compression I could bring the size down to 148 MB. This is quite OK – in numbers this is a compression of 12 from originally 1.74 GB
I hope you understand that I could not attach the whole workbook, instead I created a smaller workbook with only 50k rows by adding a TOP filter in the Power Query. This workbook can be downloaded below.
As I showed in this post, Power BI is capable of handling this kind of data very well. Both, in terms of data volume and also in terms of the type of data (unstructured/semi-structured data). Once the data is loaded into Power Pivot it can be analyzed just like any other data source using all Excel reporting capabilities.
Downloads:
Sample Excel Sheet: Wikidata_small.xlsx
Demo Script SAP HANA: Demo Script SAP HANA.docx
Power Query M-Script: Power Query M-Script.docx


Pingback: Big Data Analytics with Jedox – An example from Wikipedia
Pingback: Big Data Analytics with Jedox – An example from Wikipedia (Part 1)