Data Virtualization is actually a very new topic to me as I have barely seen it implemented in the real world or at any of my customers. But it becomes more and more interesting when working with big data where you cannot simply load all data into a single in-memory data model but still need to query across different data sources. So I decided to investigate how this could be done with my favorite reporting tool Power BI which I know is capable to connect to different data sources out of the box and also provides a rich set of visualizations that I need.
But let’s start slowly.
What is Data Virtualization?
According to Wikipedia, “Data virtualization is any approach to data management that allows an application to retrieve and manipulate data without requiring technical details about the data, such as how it is formatted at source, or where it is physically located,[1] and can provide a single customer view (or single view of any other entity) of the overall data.”
So basically, combining data from multiple sources and multiple formats into a common semantic layer which can be queried on-the-fly without the need of any ETL/ELT.
Sounds awesome – right?
The problem is that in reality the things are not as simple as they may sound, especially when it comes to joining across the different sources. While data virtualization usually works fine for small amounts of data that can be easily processed, it can be quite challenging on large amounts of data which is where data virtualization would actually make sense to avoid lengthy and costly ETL/ELT.
What does Power BI have to do with this?
At first sight – nothing. But lets examine what we currently have in Power BI:
- a semantic layer and data modelling capabilities
- access to various data sources via Direct Query (remember, we do not want to load any data!)
- ability to combine data from those sources
The last part is the most important one here and you may wonder what I am talking about. And you are right, by default a DQ model is only linked to one data source at a time but you can add other data sources manually in the Power Query editor!
This is where it get’s interesting and what this blog post is about.
Test-Case
To verify the statements from above I built a little test case that involves 2 local database and an Azure SQL database over which I want to create a semantic layer using Power BI. All three databases are actually the same AdventureWorksDW databases but for the purpose of this demonstration this is OK as it is just a technical feasibility study.
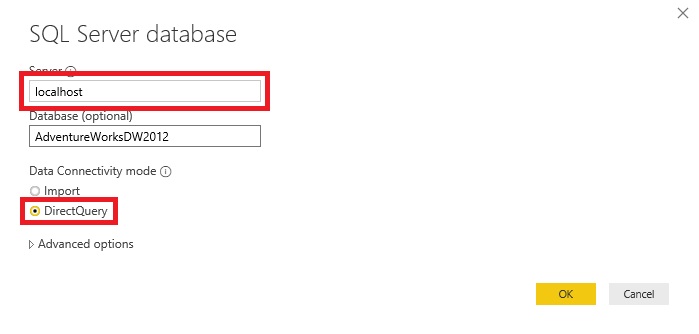
I started by creating a new Power BI file and connected it to my first data base in Direct Query mode.
Then I selected a single table, in my case I have chosen “FactResellerSales”.
The next step is to add a new table using the “Edit Queries” button on the ribbon:

You will see the one table you have just selected before as a Power Query query which you can simply copy and rename. I renamed it to “DimProduct” as I want to load the DimProduct table from my second local database which can be accomplished by simply changing the connection to the SQL database in the first step “Source” of the query (I use my second local database AdventureWorksDW2014 – instead of AdventureWorksDW2012):
Several things to point out here:
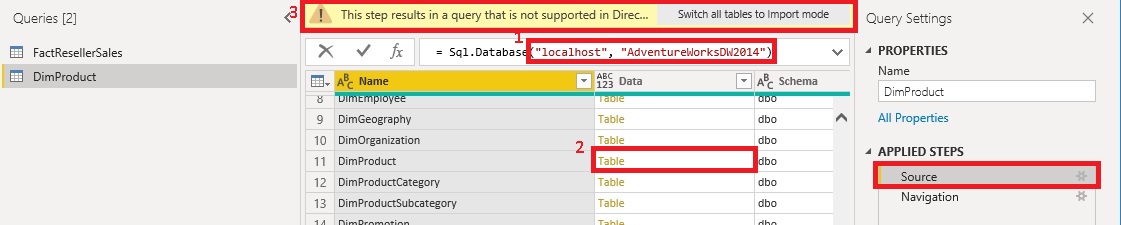
- once you change the name of the server or the database, you may get prompted for credentials
- when you click on Table in the Data column, Power BI asks you if you want to replace the next step – simply press [Yes]
- at the “Source” step, Power BI will complain that the results of the current steps are not valid in Direct Query mode – this is fine as the final result will be in the next step (“Navigation”)
I repeated the same procedure again and also added the table “DimProductSubcategory” from my Azure SQL database.
So right now we have 3 Direct Query tables pointing to 3 different databases and 3 different tables.

Now we need to connect our tables in the Relationship-view – similar as you would to with any other tables in a regular Direct Query setup:
Once the relationships are created, we can finally create our reports.
Are you excited? Well, I definitely was when I tried this setup the first time!

The visuals behave as if they were created on top of an Import Mode dataset or a Direct Query dataset that only connects to a single database. I think that is pretty awesome and again shows what Power BI is capable of!
We just used Power BI to create a semantic layer across different databases and tables which are now all joined and queried on-the-fly always showing the most recent data!
Conclusion
As you have seen, you Power BI allows us to combine multiple SQL databases in Direct Query mode and query them together as if they would be one single data source. So if you have a requirement where your data is distributed across databases and you it is too big to be loaded into memory or you need live data, you can give this approach a try. I have only tested it with regular Microsoft SQL databases but I assume that this works in a similar way with any other data source that supports Direct Query (e.g. SAP, Oracle, Spark, …) too. You can also do some basic transformations before joining the data in Direct Query mode which can also be very crucial when combining different data sources that might have slightly different formats. Again, I have not tested this thoroughly but at least everything that can be query folded should be supported as a transformation.
In a follow-up post I will explain the technical details and what actually happens in the background when you use a setup like this so stay tuned!
Interesting!
Really interested to see the queries passed to each database on SQL profiler or the Direct Query Trace events on Dax Studio.
I would add to be very careful about doing this. You could hit some serious performance problems if the sources are large and not optimized on the SQL end. Even against a single source that is true. If the source is smaller, you shouldn’t notice. Just understand that from a performance perspective, Power BI is gated by the data source (SQL in the example above).
Hi Adam,
couldn’t agree more, I even mention those things in the blog post. Data virtualization is a very complex topic and many companies tried to create a tool that solves the problem. None of them works properly without caching and thereby loosing some of the benefits of virtualization again.
I think Power BI is different here. It definitely was not developed as a data virtualization tool but the fact that it still works to some degrees shows how powerful the underlying engine is.
Regarding performance I am working on a follow up post to show technical implementation of this and some dos and don’ts and granularity of joined columns is definitely one of the main points there
-gerhard
Gerhard and all, the solution to performance issues, is resolved thru the use of Azure Analyses Services Tabular Data Model, sitting as the Data Virtualization Layer / Semantic Model Layer, in between the Databases and Power BI.
AAS can support upto 4 TB of in-memory models.
True, but this still does not make Direct Query obsolete. From an architectural standpoint and also in terms of costs
-gerhard
Pingback: Data Platform products for Microsoft gaps | James Serra's Blog